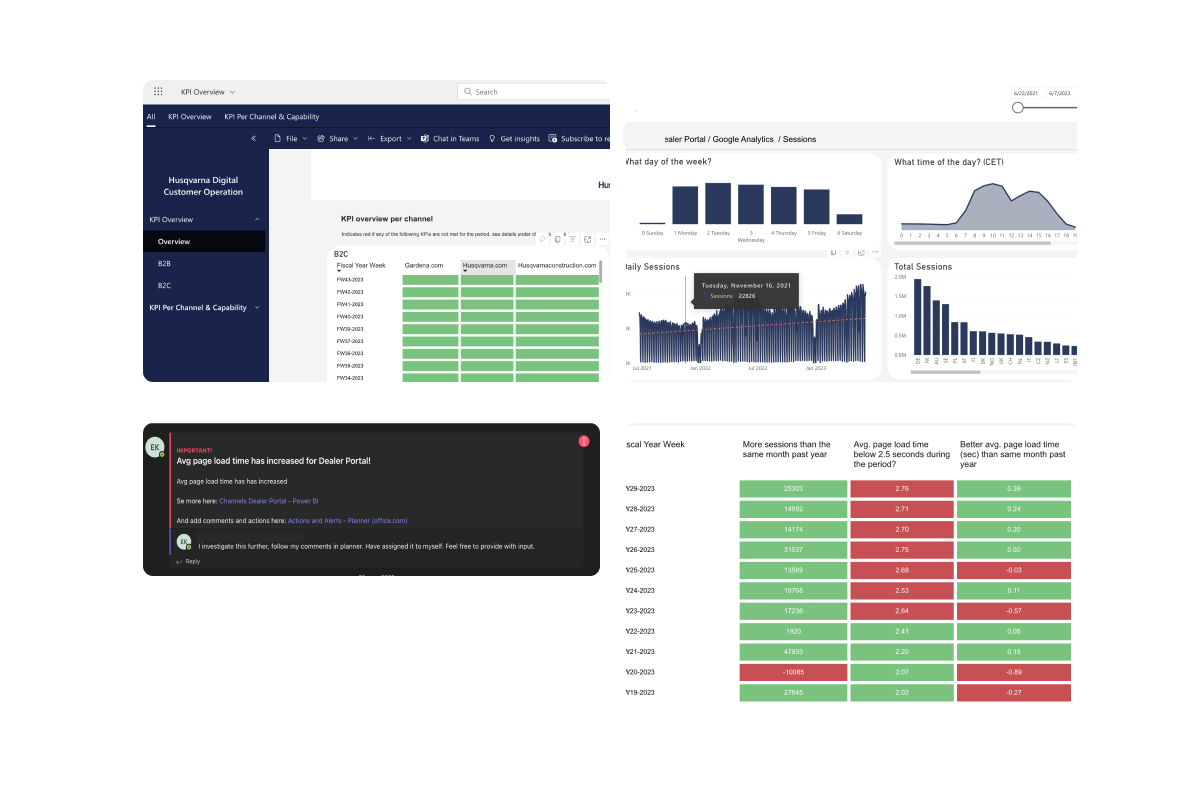
Customer-focused KPIs for better end-customer experience

Objective:
Create a solution that empowers users to define and monitor Key Performance Indicators (KPIs) for various services and channels. The solution should provide instant alerts when KPI violations occur and offer a seamless overview of data from diverse sources.
Features:
- Customizable KPIs:
- Users can define their own KPIs based on specific business requirements. These KPIs could relate to service performance, customer satisfaction, or other relevant metrics.
- Customization options include setting thresholds, time intervals, and target values.
- Alerts for KPI Violations:
- The system monitors KPIs in real-time.
- When a KPI violation occurs (e.g., service downtime, low customer engagement), instant alerts are triggered.
- Alerts can be sent via email, SMS, or integrated with other communication channels.
- Data Integration:
- The solution aggregates data from various sources, such as databases, APIs, logs, and external services.
- Integrations with existing systems ensure a comprehensive view of performance metrics.
- User-Friendly Dashboards:
- While avoiding excessive complexity, the solution provides intuitive dashboards.
- Stakeholders can visualize KPI trends, historical data, and current status.
- Dashboards highlight critical KPIs and their deviations.
- Threshold Anchoring:
- Rather than focusing solely on aesthetics, the solution emphasizes actionable insights.
- Thresholds (e.g., acceptable response time, error rates) are clearly defined.
- Stakeholders are educated on interpreting KPI data and taking prompt actions.
- Iterative Development:
- The initial version starts small, addressing essential requirements.
- Future iterations incorporate more advanced features, including AI-driven anomaly detection and predictive analytics.
Technology Stack
- Data Visualization Tool:
- PowerBI is a powerful business intelligence tool by Microsoft that allows users to create interactive visualizations and reports from various data sources.
- Data Warehousing and Analytics Platforms:
- Snowflake: Snowflake is a cloud-based data warehousing platform that provides scalability, flexibility, and performance for managing and analyzing large datasets.
- Databricks: Databricks is an analytics platform built on Apache Spark that enables data engineering, data science, and machine learning tasks in a collaborative environment.
Outcome
In summary, the Hockey Analytics Dashboard serves as a powerful tool for decision-makers to optimize team performance, enhance player development, and stay ahead of the competition. By identifying positive and negative indicators early on, organizations can take informed actions to achieve their goals. 🏒📊