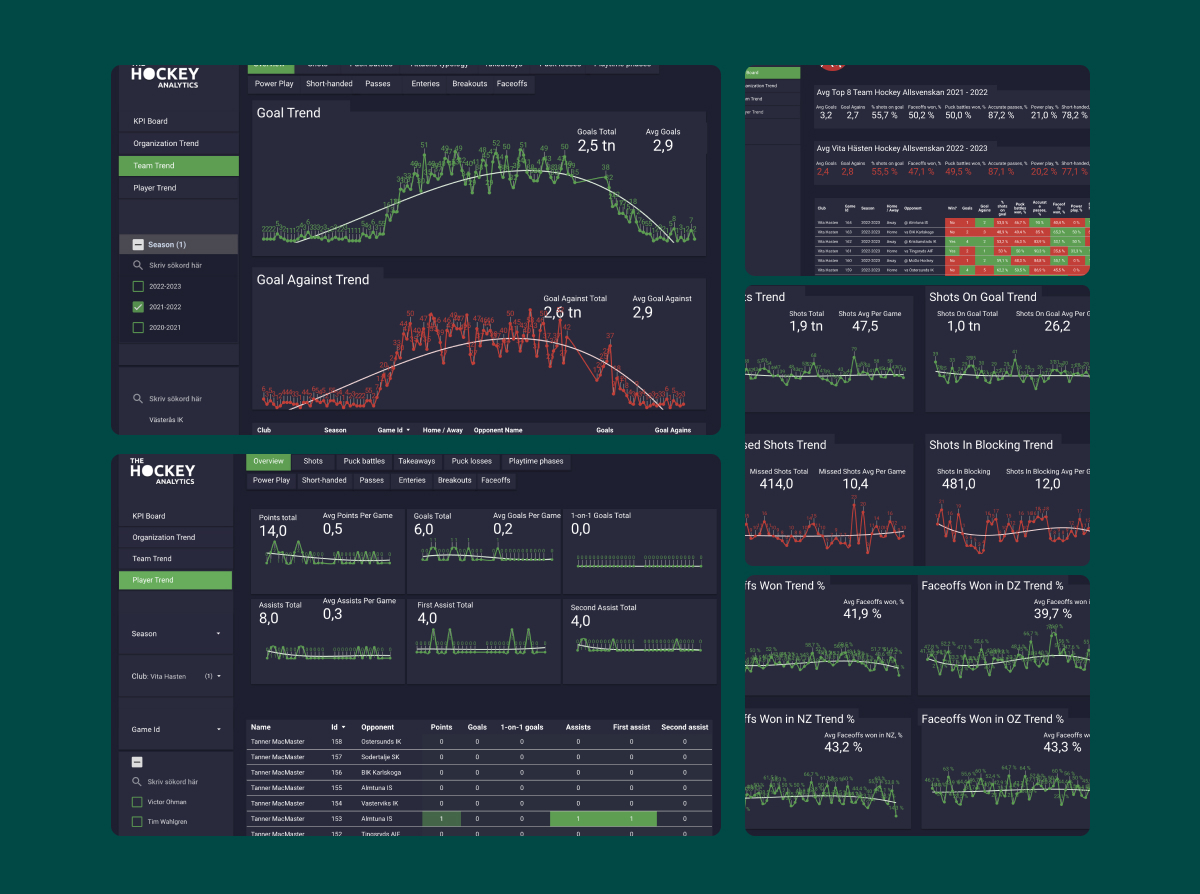
Hockey Insights Dashboard

Objectives
The Hockey Analytics Dashboard is designed to empower stakeholders within hockey organizations with actionable insights derived from publicly available data. Its primary goal is to identify trends and indicators at three levels: organizational, team, and individual. Here are the key features:
Features
- Organizational Level Insights:
- High-Level Trends: The dashboard provides an overview of performance metrics for the entire organization. This includes win-loss ratios, goal differentials, and other relevant statistics.
- Resource Allocation: Analyze resource allocation (e.g., budget, coaching staff, facilities) and its impact on team performance.
- Scouting and Recruitment: Identify potential talent based on historical data and scouting reports.
- Team Level Insights:
- Performance Metrics: Track team-specific metrics such as goals scored, shots on goal, penalty minutes, and power-play efficiency.
- Game-by-Game Analysis: Drill down into individual games to understand patterns, strengths, and weaknesses.
- Line Combinations: Evaluate the effectiveness of different player combinations (lines) during games.
- Injury and Fatigue Monitoring: Detect early signs of player fatigue or injury risk.
- Individual Level Insights:
- Player Performance: Assess individual player performance using advanced metrics (e.g., Corsi, Fenwick, expected goals).
- Player Development: Monitor player development over time, considering factors like age, position, and playing time.
- Health and Fitness: Track player fitness levels and recovery rates.
- Scouting Reports: Compare player statistics to historical benchmarks and identify areas for improvement.
- Actionable Recommendations:
- Early Warning System: Alert stakeholders to negative trends (e.g., declining performance, injury risk) so that timely corrective actions can be taken.
- Strategic Adjustments: Based on data-driven insights, recommend strategic changes (e.g., line adjustments, tactical shifts) to improve team performance.
- Opponent Analysis: Provide insights on opponents’ strengths and weaknesses to enhance game planning.
- Data Sources and Accessibility:
- The dashboard relies on publicly available data, including official league statistics, player profiles, and historical records.
- Ensure ease of access for coaches, analysts, and management personnel.
Technology Stack
- Looker Studio: Web-based tool for creating interactive dashboards.
- Azure Data Lake: Scalable cloud service for big data processing.
- Scrapy: Python framework for web scraping.
Outcome
In summary, the Hockey Analytics Dashboard serves as a powerful tool for decision-makers to optimize team performance, enhance player development, and stay ahead of the competition. By identifying positive and negative indicators early on, organizations can take informed actions to achieve their goals. 🏒📊